Fig. 4
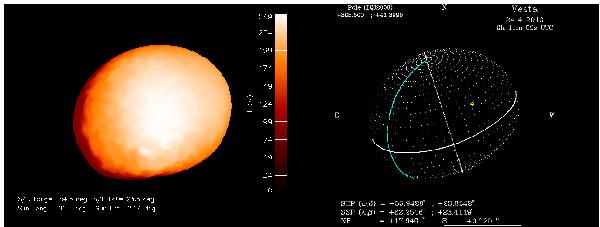
Left: temperature distribution on the surface of (4) Vesta on 2010-Apr.-24 00:12:00 UT, based on the HST-shape model in combination with the TPM. The morning side is on the left. Right: topographic coordinate system produced with the IMCCE ephemeris at the same epoch. Blue line represents the central longitude, and circles indicates the sub-solar and sub-observer points.
Current usage metrics show cumulative count of Article Views (full-text article views including HTML views, PDF and ePub downloads, according to the available data) and Abstracts Views on Vision4Press platform.
Data correspond to usage on the plateform after 2015. The current usage metrics is available 48-96 hours after online publication and is updated daily on week days.
Initial download of the metrics may take a while.