Fig. 2
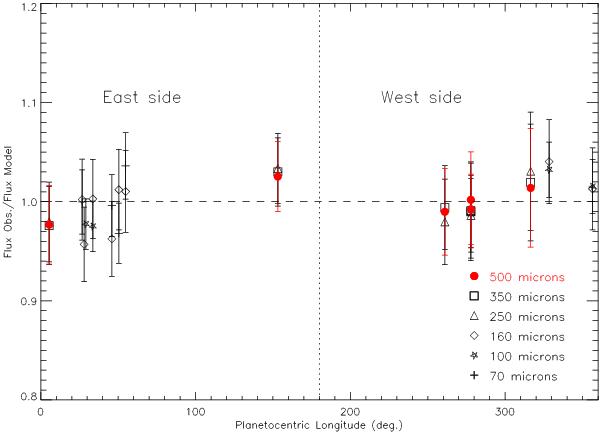
PACS and SPIRE observations of Vesta divided by the corresponding best-fit TPM predictions as function of the sub-observer planetocentric longitudes. This ratio has been corrected from the wavelength emissivity dependance. Longitudes increase eastwards. SPIRE observations performed at 500 μm are plotted in red to help the reader to compare data at different longitudes.
Current usage metrics show cumulative count of Article Views (full-text article views including HTML views, PDF and ePub downloads, according to the available data) and Abstracts Views on Vision4Press platform.
Data correspond to usage on the plateform after 2015. The current usage metrics is available 48-96 hours after online publication and is updated daily on week days.
Initial download of the metrics may take a while.