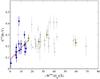
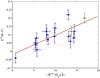
Fig. 3
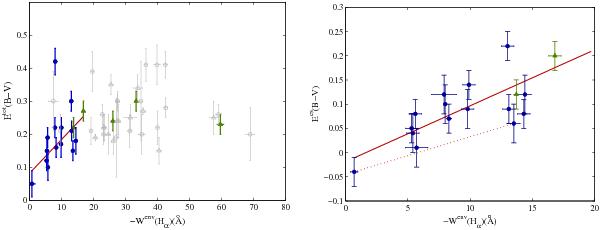
Left panel: Etotal(B − V) vs. Wenv(Hα), for LMC (blue circles) SMC (green triangles). Open triangles belong to SMC stars data from Coe et al. (2005) and spectral types from McBride et al. (2008). Open circles are data from Antoniou et al. (2009). The best fit is plotted for all stars with envelope emission lowerer than 15 Å. Right panel: Ecs(B − V) vs. Wenv(Hα) for stars with emission lower than 15 Å. Symbols as in left panel. The bottom line links two points that correspond to two different observations of 1A 0538−66.
Current usage metrics show cumulative count of Article Views (full-text article views including HTML views, PDF and ePub downloads, according to the available data) and Abstracts Views on Vision4Press platform.
Data correspond to usage on the plateform after 2015. The current usage metrics is available 48-96 hours after online publication and is updated daily on week days.
Initial download of the metrics may take a while.