Fig. 2
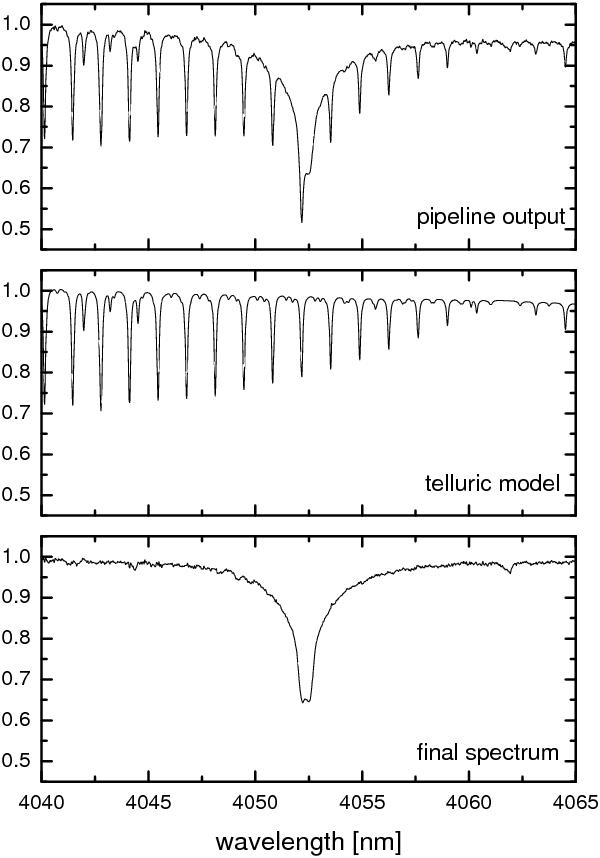
Example of our method of correcting for the telluric absorption. The top panel shows the spectrum of HD 73634 (A6 II) around the Br-α line at the level of the CRIRES pipeline data product after merging of two slightly overlapping spectral regions. The middle panel shows the telluric model calculated to fit the telluric lines in the observed spectrum. The bottom panel shows the resulting spectrum after division by the telluric spectrum and the application of some basic cosmetic corrections. Note that the emission core in the broad hydrogen line is real and not a residual of a telluric line.
Current usage metrics show cumulative count of Article Views (full-text article views including HTML views, PDF and ePub downloads, according to the available data) and Abstracts Views on Vision4Press platform.
Data correspond to usage on the plateform after 2015. The current usage metrics is available 48-96 hours after online publication and is updated daily on week days.
Initial download of the metrics may take a while.