Fig. 7
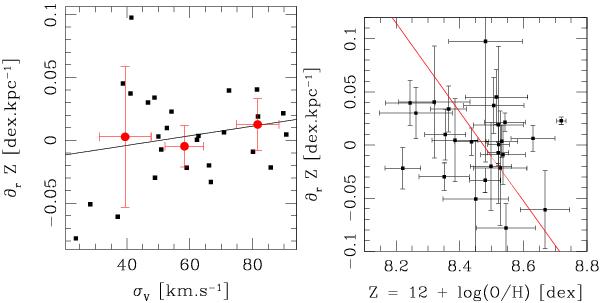
Left: metallicity gradient versus the mean velocity dispersion of MASSIV galaxies. The black squares are the individual galaxies, and the red ones represent the median values for 3 bins of σv, along with the standard deviation in each bin represented by the error bars. Right: metallicity gradients versus the integrated metallicity of each galaxy, with the red line the best fit to the data.
Current usage metrics show cumulative count of Article Views (full-text article views including HTML views, PDF and ePub downloads, according to the available data) and Abstracts Views on Vision4Press platform.
Data correspond to usage on the plateform after 2015. The current usage metrics is available 48-96 hours after online publication and is updated daily on week days.
Initial download of the metrics may take a while.