Fig. 6
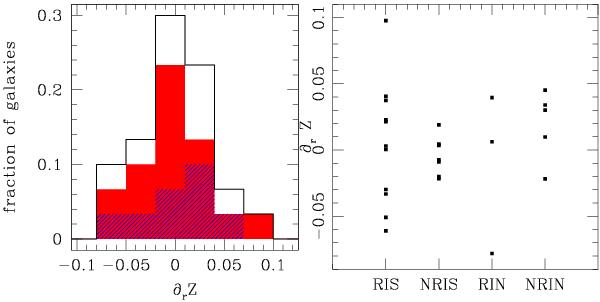
Left: metallicity gradients distribution for 26 MASSIV galaxies. The histogram in black line represents the whole sample, the red and dashed blue ones the isolated and interacting galaxies distribution respectively. Right: metallicity gradients with respect to the kinematical type (from left to right, rotating isolated, non rotating isolated, rotating interacting, non rotating interacting).
Current usage metrics show cumulative count of Article Views (full-text article views including HTML views, PDF and ePub downloads, according to the available data) and Abstracts Views on Vision4Press platform.
Data correspond to usage on the plateform after 2015. The current usage metrics is available 48-96 hours after online publication and is updated daily on week days.
Initial download of the metrics may take a while.