Fig. 5
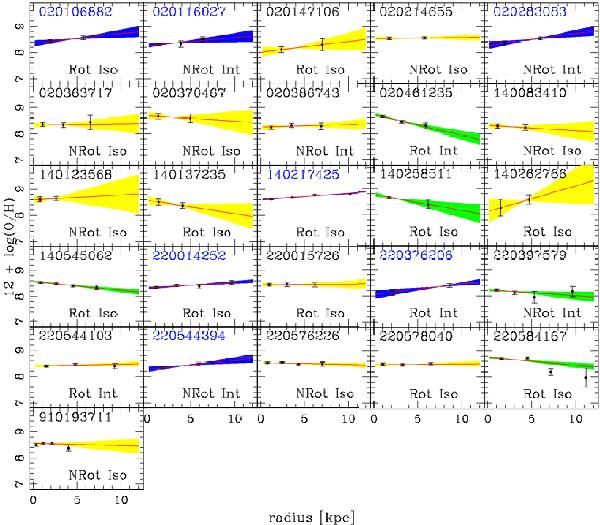
Metallicity gradient for the 26 MASSIV galaxies with spatially-resolved metallicities. The x-axis represents the mean radius (in kpc) of the region relative to the Hα center. The y-axis indicates the corresponding metallicity in dex (12 + log (O/H)). The red lines are the best fits to the data, taking the errors on the metallicities into account. The yellow/blue/green regions represent the 1σ errors associated to the gradients. Blue label indicates the galaxies for which the gradient is positive within 1σ, the green ones are those where it is negative within the same limits. For each galaxy we have indicated the dynamical (Rot = rotating disk, NRot = no rotation) and environment (Iso = isolated, Int = interacting) classes.
Current usage metrics show cumulative count of Article Views (full-text article views including HTML views, PDF and ePub downloads, according to the available data) and Abstracts Views on Vision4Press platform.
Data correspond to usage on the plateform after 2015. The current usage metrics is available 48-96 hours after online publication and is updated daily on week days.
Initial download of the metrics may take a while.