Fig. 3
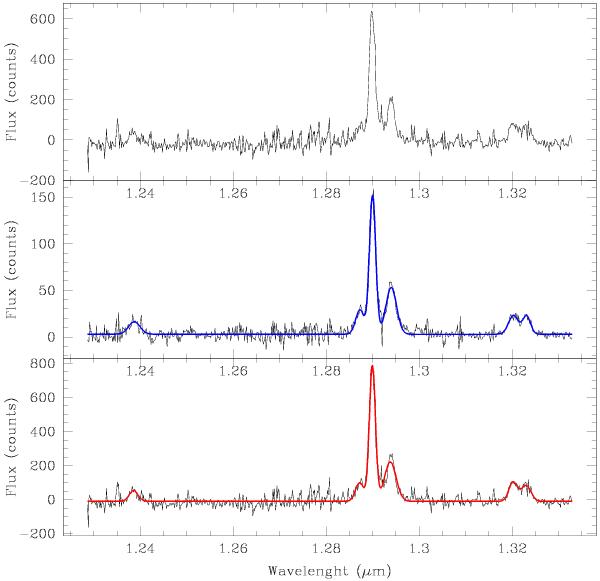
Integrated spectra of VVDS140096645. Top: spectrum of the disk (total integrated with central contribution removed). Middle: spectrum of the central region surrounding the peak of Hα flux. Bottom: spectrum from the whole spatial extent. From left to right, the following emission lines appear: [O i]6300, [N ii]6548, Hα, [N ii]6584, [S ii]6717, [S ii]6731. The red and blue lines are least-square fits to the data.
Current usage metrics show cumulative count of Article Views (full-text article views including HTML views, PDF and ePub downloads, according to the available data) and Abstracts Views on Vision4Press platform.
Data correspond to usage on the plateform after 2015. The current usage metrics is available 48-96 hours after online publication and is updated daily on week days.
Initial download of the metrics may take a while.