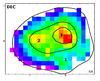
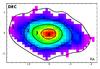
Fig. 1
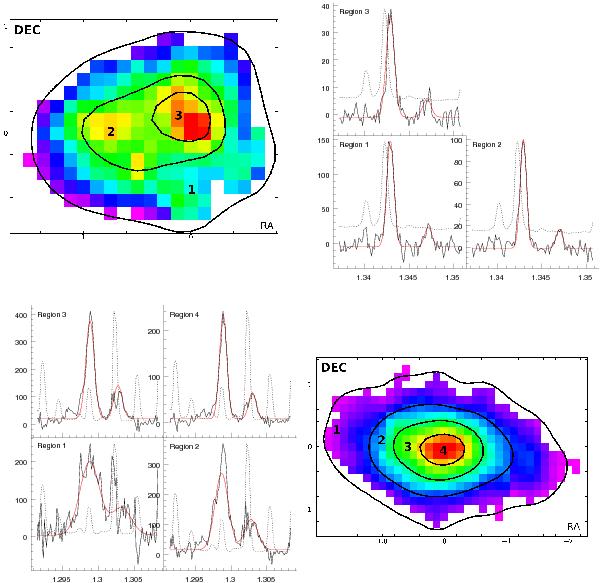
Examples of spatially-resolved emission-lines measurements in two MASSIV galaxies (top: VVDS220578040, bottom: VVDS140217425). Color-coded images show the regions defined with Hα contours used to derive the metallicity gradients. The 1D spectra integrated over the different regions are shown with solid black lines. Model (in red) and sky (dashed line) spectra are also shown. The sky spectrum is used as a weight in the fitting procedure. Region 1 is the farthest out with the region number increasing towards the center.
Current usage metrics show cumulative count of Article Views (full-text article views including HTML views, PDF and ePub downloads, according to the available data) and Abstracts Views on Vision4Press platform.
Data correspond to usage on the plateform after 2015. The current usage metrics is available 48-96 hours after online publication and is updated daily on week days.
Initial download of the metrics may take a while.