Fig. B.2
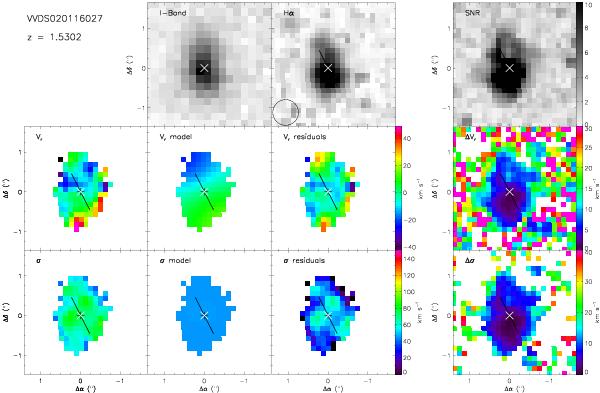
Maps for VVDS020116027 system. From left to right: (top) the I-band CFHT image (arbitrary scale), the Hα flux map (arbitrary scale) and the S/N map, (middle) the observed velocity field, the uncertainty map on the velocity field, (bottom) the observed uncorrected velocity dispersion and the uncertainty on the velocity dispersion. The redshift is indicated in the top-left. In each map, north is up and east is left. The seeing FWHM is indicated on the Hα map as a circle.
Current usage metrics show cumulative count of Article Views (full-text article views including HTML views, PDF and ePub downloads, according to the available data) and Abstracts Views on Vision4Press platform.
Data correspond to usage on the plateform after 2015. The current usage metrics is available 48-96 hours after online publication and is updated daily on week days.
Initial download of the metrics may take a while.