Fig. 9
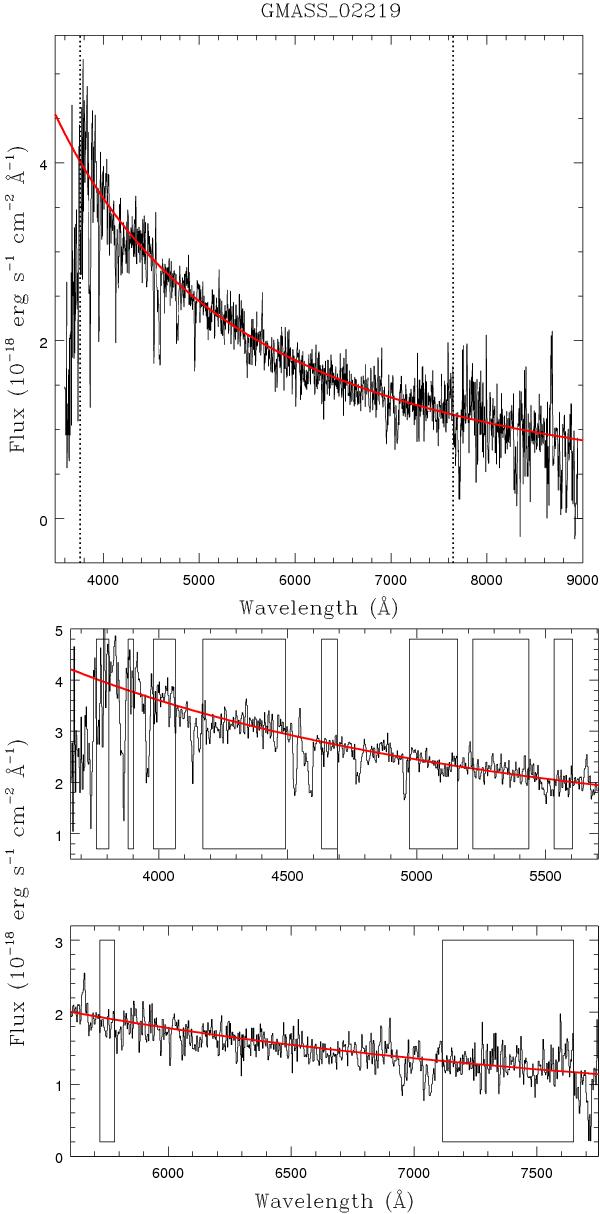
Top panel: a spectrum from our sample with corresponding fit of the continuum superimposed in red. The vertical dashed lines delineate the range covered by the windows defined by Calzetti et al. (1994) and used in the fitting procedure. Bottom panels: zoom over the wavelength range used in the fitting routine, with the ten fitting-windows indicated.
Current usage metrics show cumulative count of Article Views (full-text article views including HTML views, PDF and ePub downloads, according to the available data) and Abstracts Views on Vision4Press platform.
Data correspond to usage on the plateform after 2015. The current usage metrics is available 48-96 hours after online publication and is updated daily on week days.
Initial download of the metrics may take a while.