Fig. 5
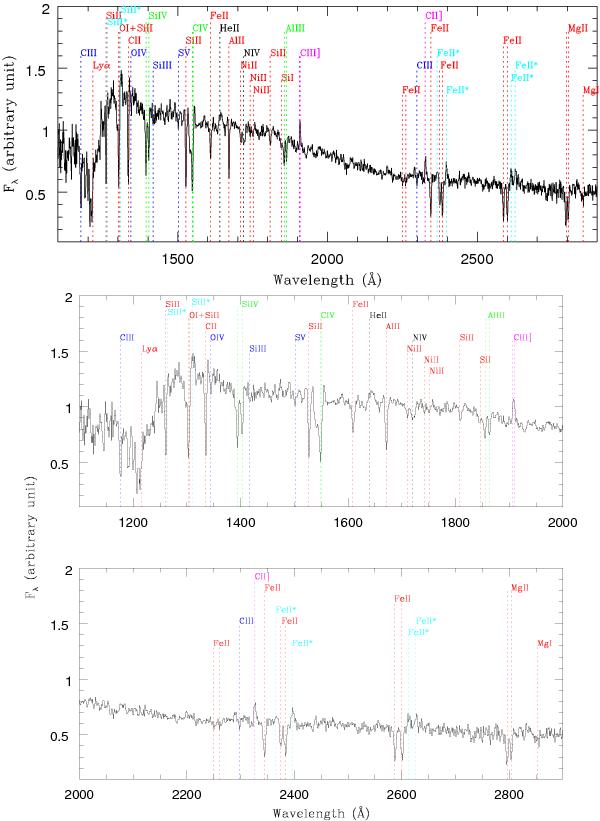
Top panel: average spectrum of the total sample (74 SFGs). Bottom two panels: zoom of the composite spectrum, above and below 2000 Å. Spectral lines of interest are labeled. Blue: absorption stellar photospheric lines; red: interstellar absorption low-ionization lines; green: interstellar absorption high-ionization lines; magenta: emission nebular lines; black: emission and absorption lines associated with stellar winds; cyan: interstellar fine-structure emission lines.
Current usage metrics show cumulative count of Article Views (full-text article views including HTML views, PDF and ePub downloads, according to the available data) and Abstracts Views on Vision4Press platform.
Data correspond to usage on the plateform after 2015. The current usage metrics is available 48-96 hours after online publication and is updated daily on week days.
Initial download of the metrics may take a while.