Fig. 2
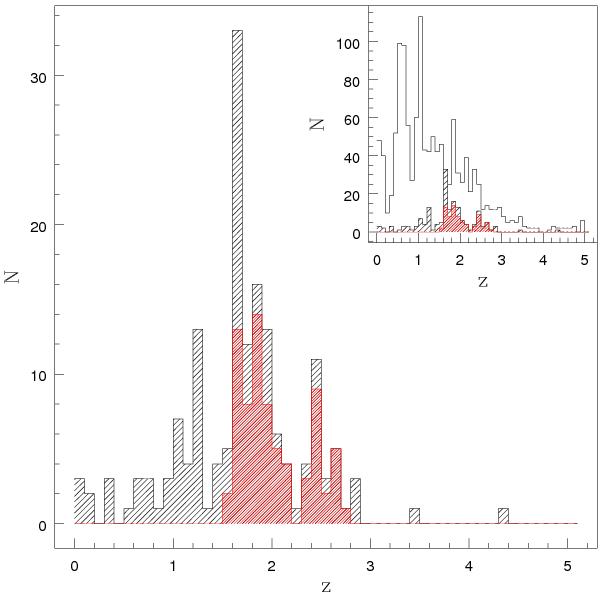
Redshift distribution. The black shaded histogram represents secure spectroscopic redshifts of the observed full GMASS sample; the red shaded histogram represents redshifts for our sub-sample of 74 high-quality SFGs. In the inset, the distribution of photometric redshifts for the whole GMASS total sample is also shown (empty histogram).
Current usage metrics show cumulative count of Article Views (full-text article views including HTML views, PDF and ePub downloads, according to the available data) and Abstracts Views on Vision4Press platform.
Data correspond to usage on the plateform after 2015. The current usage metrics is available 48-96 hours after online publication and is updated daily on week days.
Initial download of the metrics may take a while.