Free Access
Fig. 17
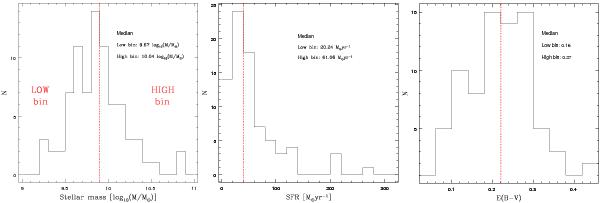
Distribution over the sample of stellar mass, SFR (from 1500 Å luminosity measured in the spectra with dust extinction derived from the continuum slope), and E(B − V) (computed from the UV continuum slope). The median value of both the sub-samples is also reported in each panel.
This figure is made of several images, please see below:
Current usage metrics show cumulative count of Article Views (full-text article views including HTML views, PDF and ePub downloads, according to the available data) and Abstracts Views on Vision4Press platform.
Data correspond to usage on the plateform after 2015. The current usage metrics is available 48-96 hours after online publication and is updated daily on week days.
Initial download of the metrics may take a while.