Fig. 16
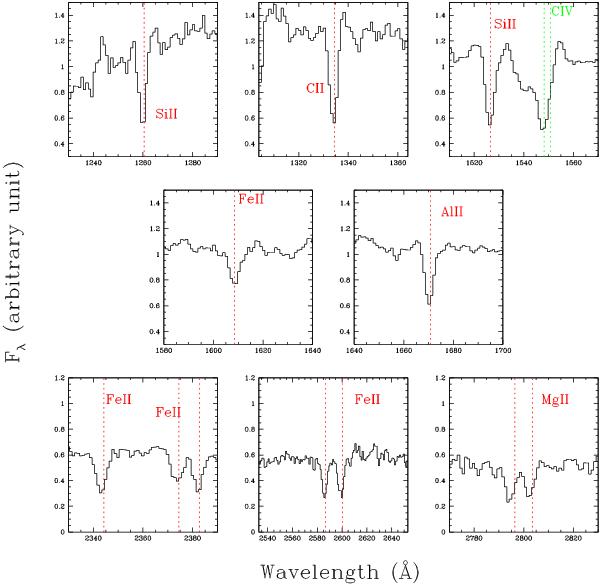
Composite spectrum of the 74 spectra of the SFG sample (see Fig. 5): zoomed-in image of the strongest low-ionization interstellar absorption lines. The C IV high-ionization doublet is also labeled. The spectrum has been shifted into its rest-frame using the velocity correction derived from the stellar/nebular lines (~135 km s-1). The vertical lines indicate the expected positions of the line.
Current usage metrics show cumulative count of Article Views (full-text article views including HTML views, PDF and ePub downloads, according to the available data) and Abstracts Views on Vision4Press platform.
Data correspond to usage on the plateform after 2015. The current usage metrics is available 48-96 hours after online publication and is updated daily on week days.
Initial download of the metrics may take a while.