Fig. 13
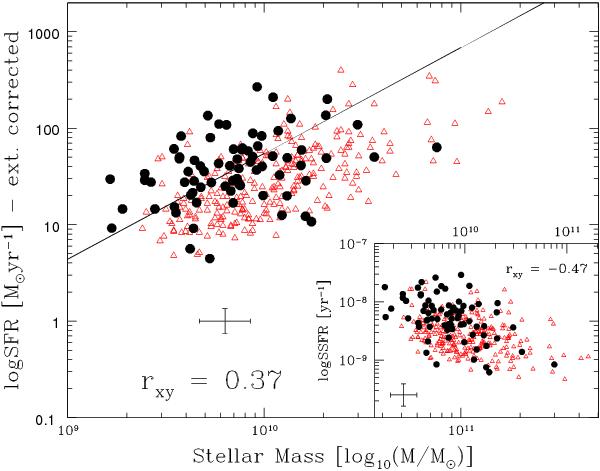
Stellar mass as a function of SFR (big panel) for the GMASS sample analyzed in this paper (black dots). Stellar masses have been computed by means of SED fitting (using Maraston 2005 models with a Kroupa IMF). The extinction-corrected SFR [M⊙ yr-1] was derived from UV luminosity measured from spectra. The black line is a linear fit to the GMASS data (in logarithmic scale). We also indicate the Pearson correlation coefficient rxy. The open red triangles represent the sample of z ~ 2 SFGs from Daddi et al. (2007) (SFRs and masses scaled for a Kroupa IMF). In the smaller panel, stellar mass as a function of specific SFR is shown.
Current usage metrics show cumulative count of Article Views (full-text article views including HTML views, PDF and ePub downloads, according to the available data) and Abstracts Views on Vision4Press platform.
Data correspond to usage on the plateform after 2015. The current usage metrics is available 48-96 hours after online publication and is updated daily on week days.
Initial download of the metrics may take a while.