Fig. 1
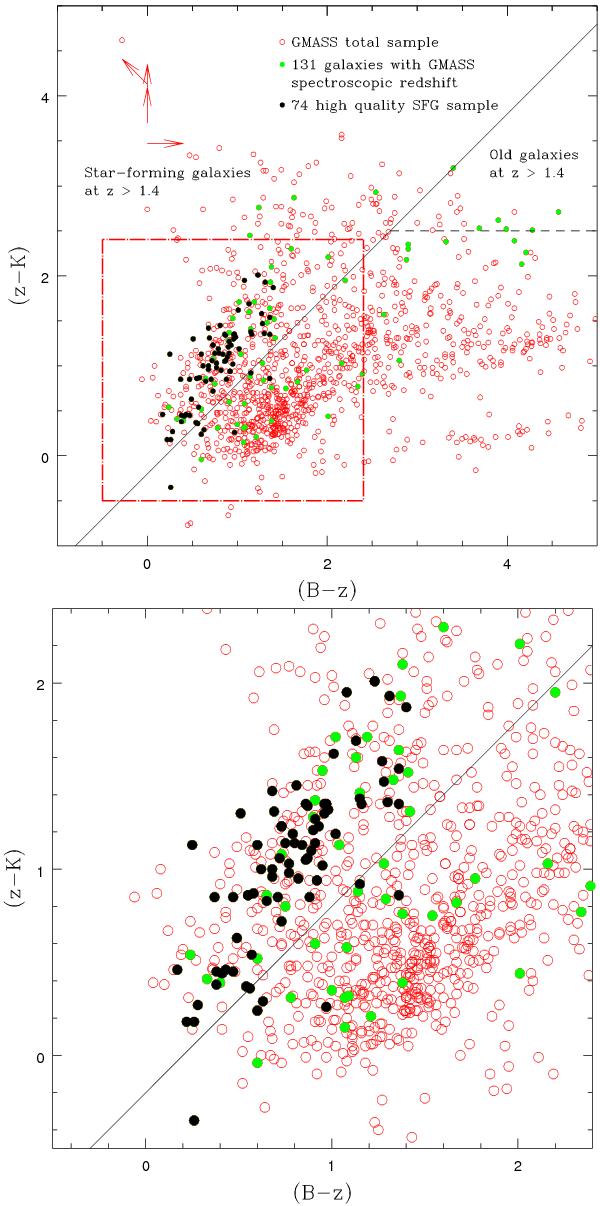
Top panel: BzK plot for the objects in the GMASS total sample (red open circles). The green dots represent the 131 objects with a secure redshift determination from the GMASS spectroscopic sample. The black dots represent the 74 high-quality SFGs analyzed in this work. Arrows indicate upper limits for objects undetected in one or more bands. Bottom panel: zoom on the 74 SFG sample.
Current usage metrics show cumulative count of Article Views (full-text article views including HTML views, PDF and ePub downloads, according to the available data) and Abstracts Views on Vision4Press platform.
Data correspond to usage on the plateform after 2015. The current usage metrics is available 48-96 hours after online publication and is updated daily on week days.
Initial download of the metrics may take a while.