Fig. 2

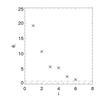
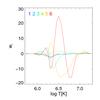
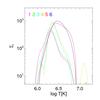
Singular values φi (left), singular vectors wi (middle) and the regularized solution Eq. (6) as a function of i (right). The lines in the singular value plot (left) indicate the regularization parameter λ that produces the solution with desired χ2 (dashed line) and with the additional positivity constraint (dash dot line). These values are from the regularized solution shown in Fig. 3.
Current usage metrics show cumulative count of Article Views (full-text article views including HTML views, PDF and ePub downloads, according to the available data) and Abstracts Views on Vision4Press platform.
Data correspond to usage on the plateform after 2015. The current usage metrics is available 48-96 hours after online publication and is updated daily on week days.
Initial download of the metrics may take a while.