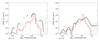
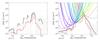
Fig. 17

Regularized emission measure distributions (black solid line and grey error bars) for the active region core observations made by Warren et al. (2010), their MCMC solution (red histogram) is shown for comparison. In the right-hand panels the positivity constraint was used and hence larger χ2 values are achieved by the regularized solutions. The EM loci curves for the Hinode/EIS (coloured lines) and Hinode/XRT filter (black dashed line) are shown in the bottom left panel and their minimum was used as an initial guess solution for the regularizations shown in the bottom row.
Current usage metrics show cumulative count of Article Views (full-text article views including HTML views, PDF and ePub downloads, according to the available data) and Abstracts Views on Vision4Press platform.
Data correspond to usage on the plateform after 2015. The current usage metrics is available 48-96 hours after online publication and is updated daily on week days.
Initial download of the metrics may take a while.