Free Access
Fig. 16
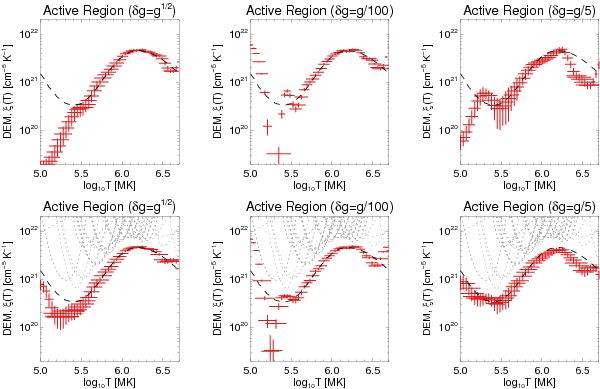
Regularized DEMs (red error bars) for simulated Hinode/EIS lines of the CHIANTI active region DEM model. The error is taken as the Poisson noise and 1% and 20% of the line intensity (left to right). In the bottom row the minimum of the EM loci curves (grey dotted lines) has been used as the guess solution ξ0(T).
Current usage metrics show cumulative count of Article Views (full-text article views including HTML views, PDF and ePub downloads, according to the available data) and Abstracts Views on Vision4Press platform.
Data correspond to usage on the plateform after 2015. The current usage metrics is available 48-96 hours after online publication and is updated daily on week days.
Initial download of the metrics may take a while.