Fig. 9
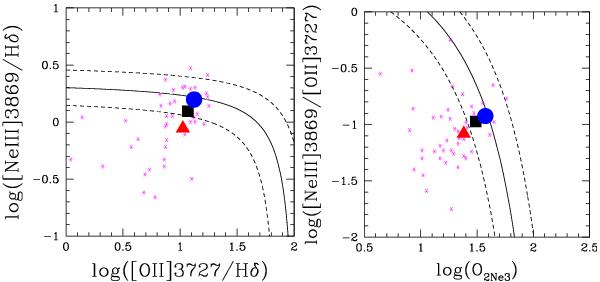
Diagnostic diagrams based on [Ne iii]λ3869 emission line. In the left-hand panel, the relation between the emission- line ratios [Ne iii]λ3869/Hδ and [O ii]λ3727/Hδ is shown and in the right-hand panel the relation between the emission- line ratio [Ne iii]λ3869/ [O ii]λ3727 and the O2Ne3=([O ii]λ3727 + 15.37[Ne iii]λ3869)/Hδ parameter is shown. The solid lines represent the analytical division (see Perez-Montero et al. 2007) between star-forming galaxies (lower left) and AGNs (upper right). The dashed lines represent the limit of the bands of uncertainty of 0.15 dex on both sides of each relation. Black square, blue point, and red triangle show the location of emission-line ratios measured in the composite spectrum of the full MASSIV sample, of galaxies with stellar mass lower than 1.6 × 10¹⁰ M⊙, and of galaxies with stellar mass higher than 1.6 × 10¹⁰ M⊙, respectively. Magenta asterisks show the location of individual VVDS galaxies with measured [Ne iii]λ3869 emission line (Perez-Montero et al. 2009).
Current usage metrics show cumulative count of Article Views (full-text article views including HTML views, PDF and ePub downloads, according to the available data) and Abstracts Views on Vision4Press platform.
Data correspond to usage on the plateform after 2015. The current usage metrics is available 48-96 hours after online publication and is updated daily on week days.
Initial download of the metrics may take a while.