Fig. 7
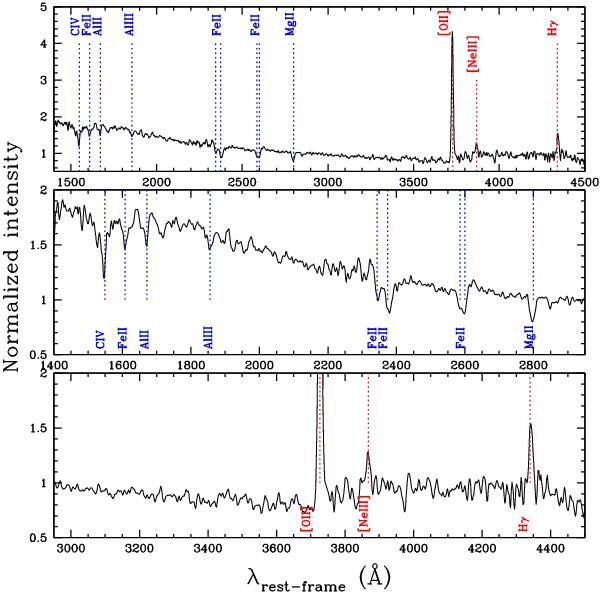
Top: rest-frame stacked VIMOS spectrum for the full MASSIV sample (83 galaxies after exclusion of VVDS220148046 at z = 2.24) normalized at the continuum level at λ = 3000 Å. The position of main absorption (blue) and emission (red) lines is indicated with dotted lines. The middle and bottom panels are for the same spectrum but zoomed-in on specific wavelength ranges.
Current usage metrics show cumulative count of Article Views (full-text article views including HTML views, PDF and ePub downloads, according to the available data) and Abstracts Views on Vision4Press platform.
Data correspond to usage on the plateform after 2015. The current usage metrics is available 48-96 hours after online publication and is updated daily on week days.
Initial download of the metrics may take a while.