Fig. 9
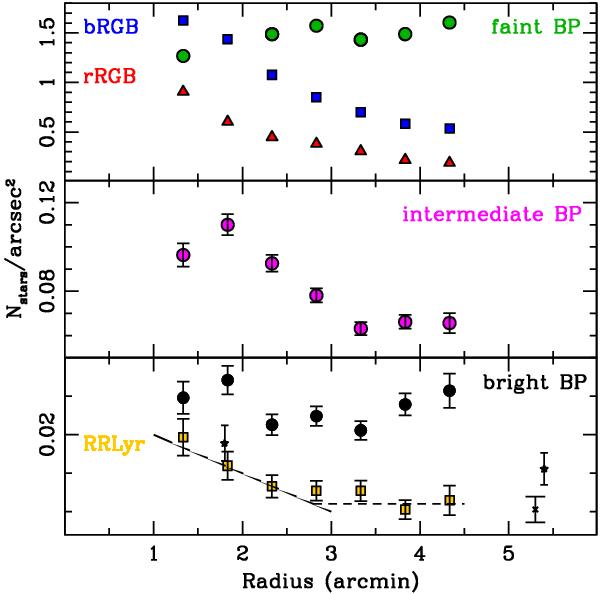
The variation of the fraction of stars with the distance from the centre of M 32 for the populations selected from the CMD. The colour code is the same used in Fig. 8. The poissonian errorbars are plotted where they are larger than the symbols. Top panel, the bRGB, the rRGB and the faint BP have been plotted with circles, squares and stars, respectively. In the middle panel the intermediate BP distribution is plotted. The bottom panel shows the RR Lyr and the bright BP radial distributions with squares and circles, respectively. The bright BP circles have been shifted of +0.01, to make the plot more clear. A comparison with previous RR Lyr detections is also shown with stars (F1 and F2 Fiorentino et al. 2010b) and cross (F1 from Sarajedini et al. 2009). Solid and dashed lines represent the fit to M 32 and M 31 profiles, respectively.
Current usage metrics show cumulative count of Article Views (full-text article views including HTML views, PDF and ePub downloads, according to the available data) and Abstracts Views on Vision4Press platform.
Data correspond to usage on the plateform after 2015. The current usage metrics is available 48-96 hours after online publication and is updated daily on week days.
Initial download of the metrics may take a while.