Fig. 7
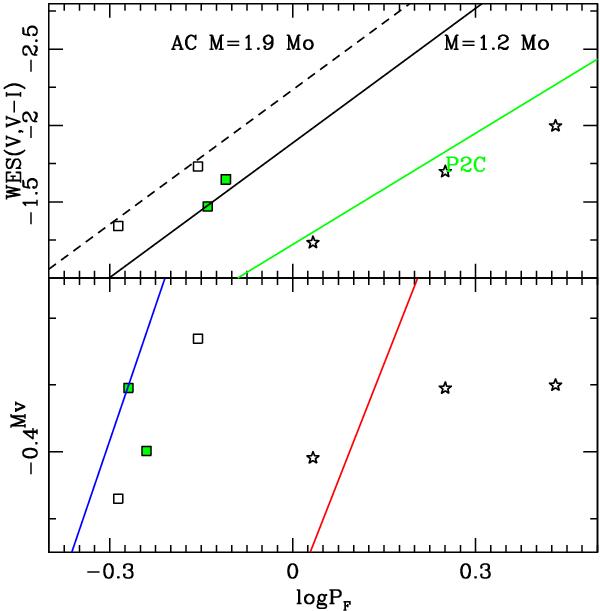
Bottom: anomalous Cepheids (squares) and Population II Cepheids (stars) in the MV-period (P) plane. First-overtone AC have been highlighted with filled colour (green). It is not possible to make a clear classification between these two class of variables. We have plotted the cold (red) and the warm (blue) edges of the pulsation instability strip as derived by theoretical models (Fiorentino et al. 2006). Top: wesenheit plane, where the separation between the anomalous Cepheids and Population II Cepheids is clearer. The green solid line represents the relation for Population II Cepheids, and the black solid and dashed line represent the mass dependent Wesenheit relations for anomalous Cepheids, with masses 1.2 M⊙ and 1.9 M⊙ respectively. The distance modulus assumed is 24.33, as we found from RR Lyr.
Current usage metrics show cumulative count of Article Views (full-text article views including HTML views, PDF and ePub downloads, according to the available data) and Abstracts Views on Vision4Press platform.
Data correspond to usage on the plateform after 2015. The current usage metrics is available 48-96 hours after online publication and is updated daily on week days.
Initial download of the metrics may take a while.