Fig. 4
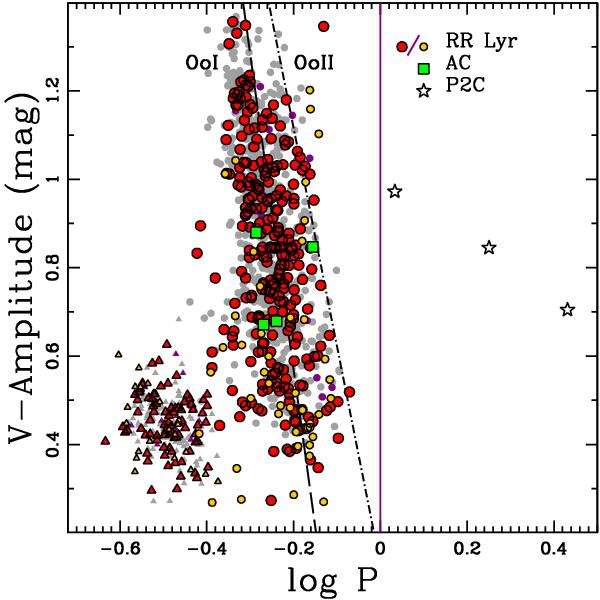
The V filter amplitude – period (P) Bailey diagram for our observations (coloured symbols) and the observations of M 31 RR Lyr from Sarajedini et al. (2009) and Brown et al. (2004) as grey and magenta symbols. The Oosterhoff type loci, OoI (dashed) and OoII (dot-dashed), are shown (from Clement 2000). For the RR Lyr the triangles are first-overtone pulsators and the circles are fundamental pulsators. RR Lyr two-filters are plotted in red and only in one-filter in orange. Anomalous Cepheids and Population II Cepheids are indicated with squares (green) and stars, respectively.
Current usage metrics show cumulative count of Article Views (full-text article views including HTML views, PDF and ePub downloads, according to the available data) and Abstracts Views on Vision4Press platform.
Data correspond to usage on the plateform after 2015. The current usage metrics is available 48-96 hours after online publication and is updated daily on week days.
Initial download of the metrics may take a while.