Fig. 1
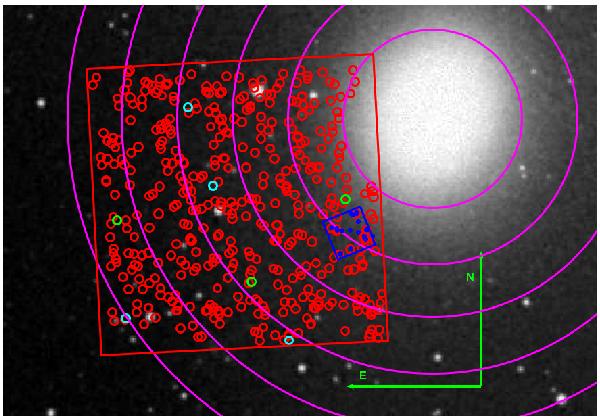
A 6 × 5 arcmin DSS2 where our ACS/WFC field is shown as a large (red) square. The HRC field with its RR Lyr (from Fiorentino et al. 2010b) is shown as a small (blue) square. The RR Lyr, anomalous Cepheid and Population II Cepheid variables detected in the ACS/WFC field are shown as red, cyan and green points, respectively. Circles centred on M 32 used in the density analysis are plotted in magenta.
Current usage metrics show cumulative count of Article Views (full-text article views including HTML views, PDF and ePub downloads, according to the available data) and Abstracts Views on Vision4Press platform.
Data correspond to usage on the plateform after 2015. The current usage metrics is available 48-96 hours after online publication and is updated daily on week days.
Initial download of the metrics may take a while.