Free Access
Fig. 7
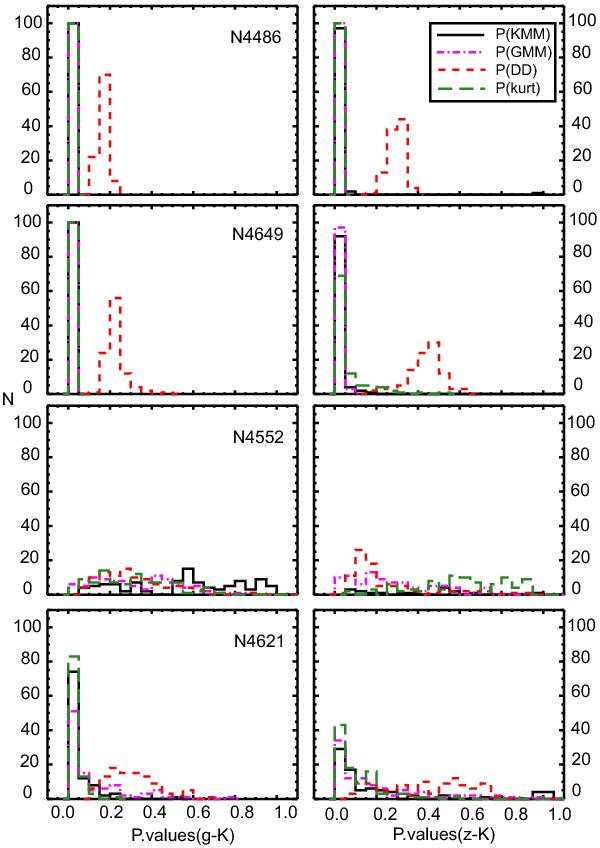
Histograms of the probability values returned by KMM and GMM on the output of the simulations for the cluster rich galaxies with obvious (g − z) bimodality and nearly equal number of clusters assigned for the blue and red peaks; for (g − K) (left panels) and (z − K) (right panels).
Current usage metrics show cumulative count of Article Views (full-text article views including HTML views, PDF and ePub downloads, according to the available data) and Abstracts Views on Vision4Press platform.
Data correspond to usage on the plateform after 2015. The current usage metrics is available 48-96 hours after online publication and is updated daily on week days.
Initial download of the metrics may take a while.