Fig. 5
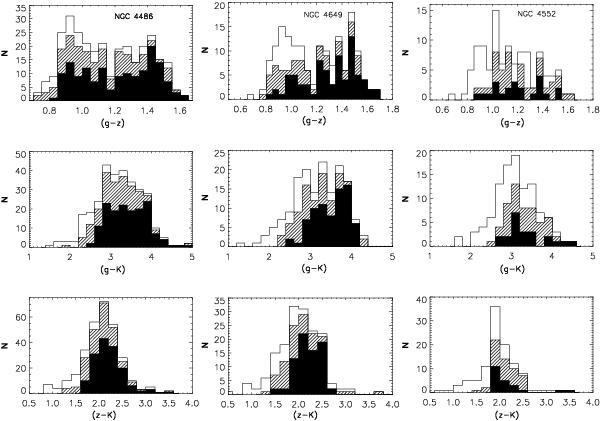
NGC 4486, NGC 4649, and NGC 4552 colour distributions in (g − z), (g − k) and (z − k). The open histogram are the colour distributions for all clusters that make the final sample, according to the criteria outlined is Sect. 2. The hashed histograms show the same distributions when only the clusters with Kerr ≤ 0.1 are left in the sample and the filled histogram when only the clusters with Kerr ≤ 0.05 are present.
Current usage metrics show cumulative count of Article Views (full-text article views including HTML views, PDF and ePub downloads, according to the available data) and Abstracts Views on Vision4Press platform.
Data correspond to usage on the plateform after 2015. The current usage metrics is available 48-96 hours after online publication and is updated daily on week days.
Initial download of the metrics may take a while.