Free Access
Fig. 10
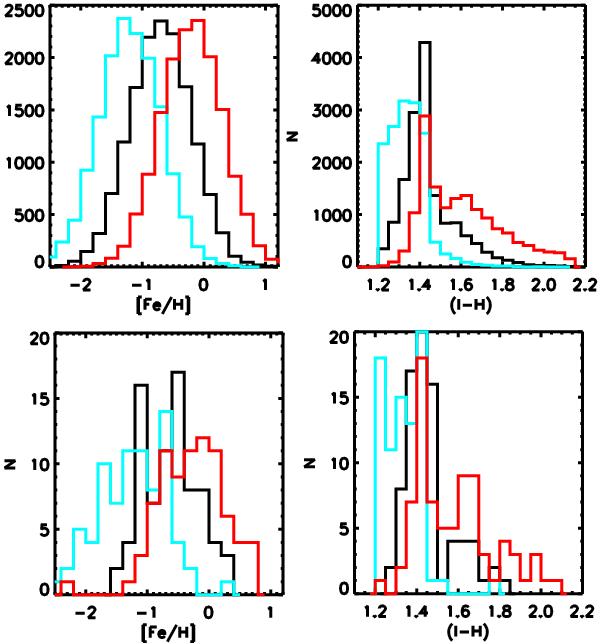
Simulations of unimodal metallicity distributions with different means for 15 000 (upper left panel) and 80 GCs (bottom left panel) transformed to (I − H) according to the 14 Gyr SPoT – (I − H) – metallicity relation. The resulting respective (I − H) distributions are shown in the top and bottom right panels.
Current usage metrics show cumulative count of Article Views (full-text article views including HTML views, PDF and ePub downloads, according to the available data) and Abstracts Views on Vision4Press platform.
Data correspond to usage on the plateform after 2015. The current usage metrics is available 48-96 hours after online publication and is updated daily on week days.
Initial download of the metrics may take a while.