Fig. 8
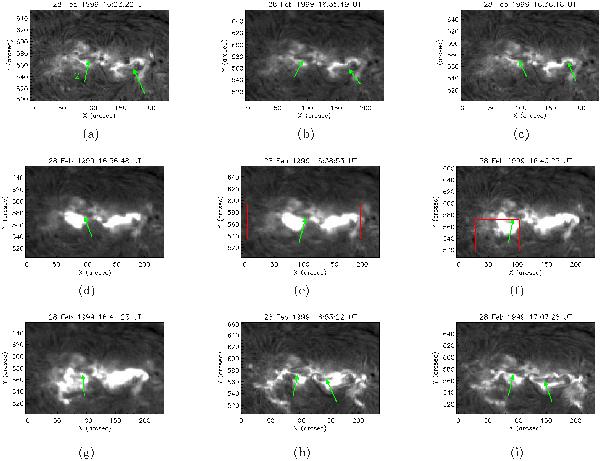
Flare evolution from 10 min before the beginning of the impulsive phase to 40 min after the flare in Hα, using a selected area of full disk BBSO images; the green arrows indicate the position of the two main filaments associated to the flare. The boxes in e) and f) indicate areas of increased brightness during the flare impulsive phase (see text). The field of view of the images is 182 × 120 Mm2.
Current usage metrics show cumulative count of Article Views (full-text article views including HTML views, PDF and ePub downloads, according to the available data) and Abstracts Views on Vision4Press platform.
Data correspond to usage on the plateform after 2015. The current usage metrics is available 48-96 hours after online publication and is updated daily on week days.
Initial download of the metrics may take a while.