Fig. 4
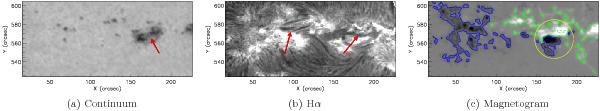
a) Image in the continuum acquired at BBSO at 17:49:52 UT on 28 February 1999, the arrow indicates a sunspot with a δ-configuration; b) High resolution Hα image acquired at BBSO at 17:49:48 UT, showing several filaments; the arrows indicate two filaments involved in the flaring process; c) Magnetogram acquired at BBSO, showing the magnetic configuration of the active region at 17:49:52 UT; the blue and green contours indicate the negative and positive magnetic field at ± 200 (solid line), ± 1000 G (dashed line). The circle indicates the location of the δ spot. The images have a field of view of 161 × 61 Mm2.
Current usage metrics show cumulative count of Article Views (full-text article views including HTML views, PDF and ePub downloads, according to the available data) and Abstracts Views on Vision4Press platform.
Data correspond to usage on the plateform after 2015. The current usage metrics is available 48-96 hours after online publication and is updated daily on week days.
Initial download of the metrics may take a while.