Fig. 2
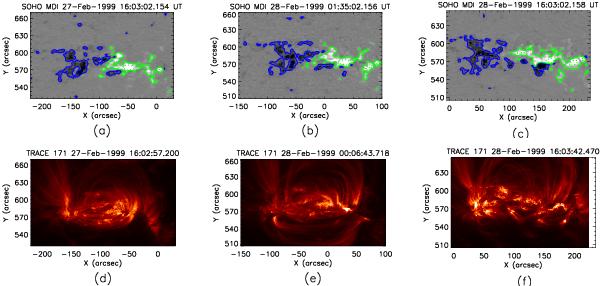
Top row: SOHO/MDI images acquired at a): 16:03 UT on 27 Feb.; b): at 01:35 UT on 28 Feb.; c): at 16:03 UT on 28 Feb. The blue and green contours indicate the negative and positive magnetic field at ± 200 (solid line), 1000 G (dashed line). Bottom row: TRACE 171 Å images acquired at d): 16:03 UT on 27 Feb.; e): 00:07 UT on 28 Feb.; f): 16:03 UT on 28 Feb. The images have a field of view of 192 × 115 Mm2. In this and in the following images North is at the top, West is at the right.

Current usage metrics show cumulative count of Article Views (full-text article views including HTML views, PDF and ePub downloads, according to the available data) and Abstracts Views on Vision4Press platform.
Data correspond to usage on the plateform after 2015. The current usage metrics is available 48-96 hours after online publication and is updated daily on week days.
Initial download of the metrics may take a while.