Fig. 14
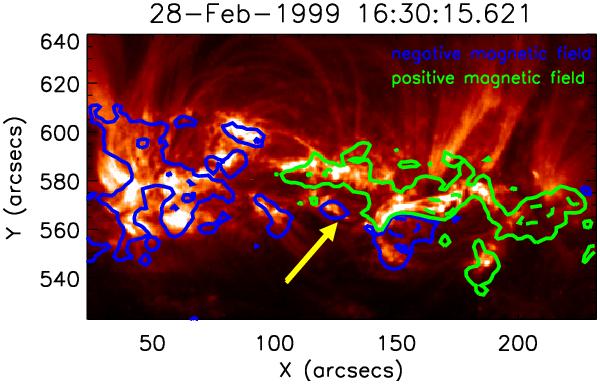
Isocontours of the magnetic field strength deduced from the MDI magnetogram taken at 16:03:02 UT over the TRACE 171 Å image taken at 16:30:15 UT. The green and blue contours indicate the positive and negative magnetic field at ± 200 (solid line), ± 1000 G (dashed line). The field of view is of 160 × 90 Mm2. The arrow shows a small bright loop which disappears during the flare (see Fig. 13).
Current usage metrics show cumulative count of Article Views (full-text article views including HTML views, PDF and ePub downloads, according to the available data) and Abstracts Views on Vision4Press platform.
Data correspond to usage on the plateform after 2015. The current usage metrics is available 48-96 hours after online publication and is updated daily on week days.
Initial download of the metrics may take a while.