Fig. 9
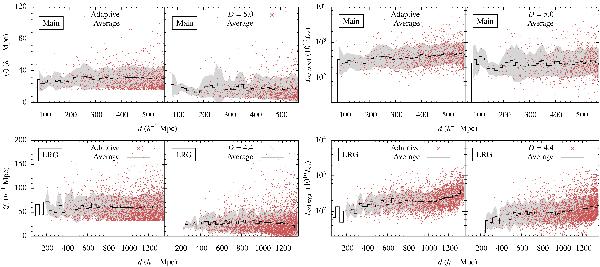
Supercluster diameters (left panels) and total weighted luminosities (right panels) vs. distance for fixed and adaptive thresholds. The main sample is shown on the upper row and LRG on the lower. Points mark the diameters and luminosities of individual superclusters; the line is the average with the bin widths of 10 h-1 Mpc for the main and 25 h-1 Mpc for the LRG sample. The standard deviations in bins are shown with grey contours.
Current usage metrics show cumulative count of Article Views (full-text article views including HTML views, PDF and ePub downloads, according to the available data) and Abstracts Views on Vision4Press platform.
Data correspond to usage on the plateform after 2015. The current usage metrics is available 48-96 hours after online publication and is updated daily on week days.
Initial download of the metrics may take a while.