Fig. 15
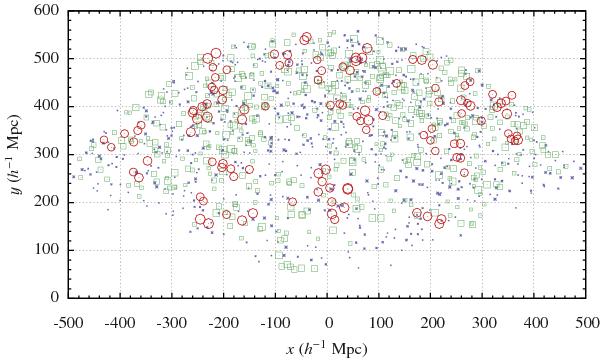
The SDSS main sample supercluster map. Different symbol types and sizes show the density threshold levels used to delineate the superclusters; blue points: D ≤ 3.0, green squares: 4.0 < D ≤ 4.5, and red rings: D > 4.5. The map is the 2D projection of the whole supercluster sample. Substantial differences in the levels can be seen e.g., in the regions around (−60, 300) and at the Sloan Great Wall region at (0, 220).
Current usage metrics show cumulative count of Article Views (full-text article views including HTML views, PDF and ePub downloads, according to the available data) and Abstracts Views on Vision4Press platform.
Data correspond to usage on the plateform after 2015. The current usage metrics is available 48-96 hours after online publication and is updated daily on week days.
Initial download of the metrics may take a while.