Fig. A.1
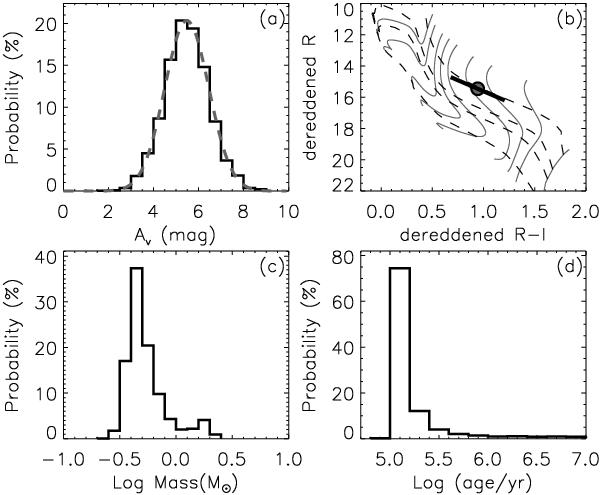
a) The distribution of extinction sampled from the extinction probability function derived from Fig. 10b. The dashed line shows the the extinction probability function. b) The locations of source ID#14 (see Table 1) on R vs. R − I color–magnitude diagram. The source ID#14 has been dereddened with the extinction values in panel a). The filled circle show the location of source ID#14 with highest probability. The black thick line represent the positions where source ID#14 is located with >68.3% probability. The dashed lines are PMS isochrones of 0.1, 1, 3, and 30 Myr (Dotter et al. 2008). The thin gray lines are the evolutionary tracks for PMS stars with masses of 0.1, 0.3, 0.4, 0.5, 0.7, 0.9, 1.2, 2.0, and 3.0 M⊙, respectively. The mass and age distributions of source ID#14 derived from its locations on R vs. R − I color–magnitude diagram are shown in panel c) and d), respectively.
Current usage metrics show cumulative count of Article Views (full-text article views including HTML views, PDF and ePub downloads, according to the available data) and Abstracts Views on Vision4Press platform.
Data correspond to usage on the plateform after 2015. The current usage metrics is available 48-96 hours after online publication and is updated daily on week days.
Initial download of the metrics may take a while.