Fig. 11
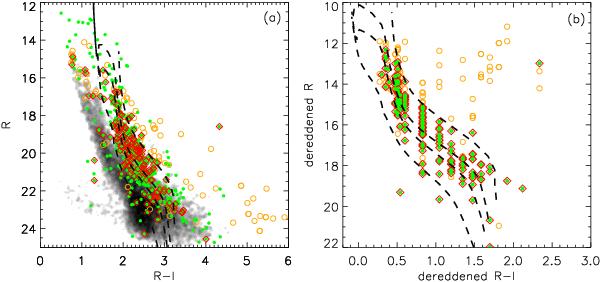
a) R vs. R − I color–magnitude diagram for the stars detected on the VIMOS images. The dashed lines are PMS isochrones of 0.1, 1, 3, and 30 Myr (Dotter et al. 2008). The solid line represents the ZAMS (Schaller et al. 1992). The isochrones are reddened by the mode of the extinction distribution of the spectroscopic members of Pismis 24 cluster. The grey density map presents the distribution of all detected sources on the VIMOS images. The filled circles show the counterparts of X-ray sources. The open diamonds mark the X-ray emission stars that have been observed with VIMOS spectroscopy. The open circles present the stars without detected X-ray emissions that have been observed with VIMOS spectroscopy. b) The dereddened R vs. R − I color–magnitude diagram for the spectroscopic sample. The extinction for each star is estimated by comparing the observed R − I color with the intrinsic R − I color expected from the spectral type. The symbols are same as in panel a).
Current usage metrics show cumulative count of Article Views (full-text article views including HTML views, PDF and ePub downloads, according to the available data) and Abstracts Views on Vision4Press platform.
Data correspond to usage on the plateform after 2015. The current usage metrics is available 48-96 hours after online publication and is updated daily on week days.
Initial download of the metrics may take a while.