Fig. 10
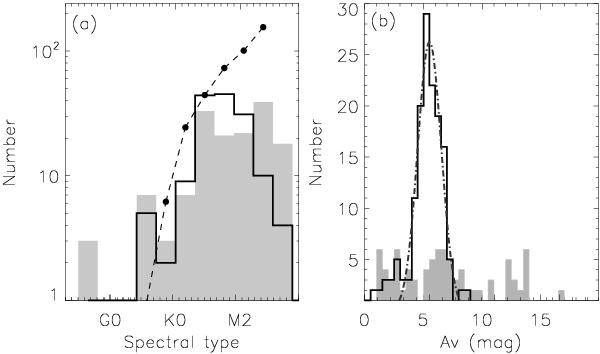
a) The spectral-type distribution of our spectroscopic sample. The filled histogram shows the distribution of stars without X-ray emission. The open histograms display the distribution of X-ray emission stars. The dotted line connecting filled circles show the predicted distribution of spectral type for a 1 Myr cluster with an IMF like that of the Trapezium cluster. The distribution is normalized to the number of K4-K6 stars. b) The distribution of extinction for the spectroscopic sample. The filled histogram shows the distribution of stars without X-ray emission. The open histogram shows the distribution of X-ray emitting stars. The dash-dotted line denotes the Gaussian fit to the open histogram, peaking at AV = 5.5 mag with a FWHM of 2.2 mag.
Current usage metrics show cumulative count of Article Views (full-text article views including HTML views, PDF and ePub downloads, according to the available data) and Abstracts Views on Vision4Press platform.
Data correspond to usage on the plateform after 2015. The current usage metrics is available 48-96 hours after online publication and is updated daily on week days.
Initial download of the metrics may take a while.