Fig. 1
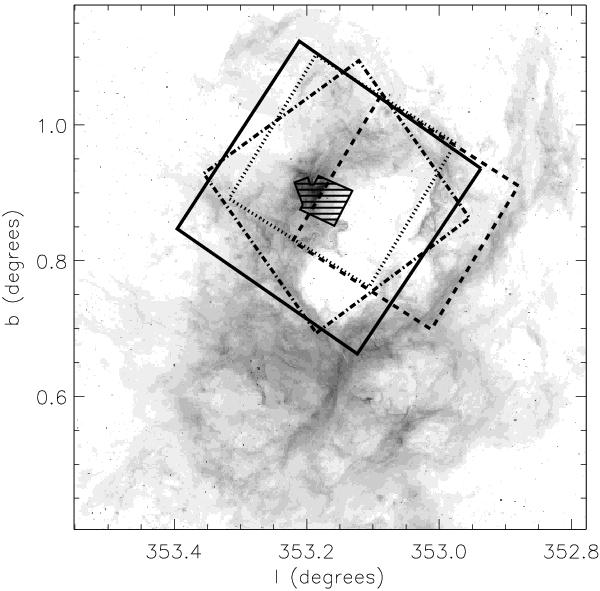
The FOVs of different observations used in this paper. The background: 8.0 μm (GLIMPSE). The FOVs of our deep IRAC imaging are shown with the dashed lines ([3.6] and [5.8] bands) and dotted lines ([4.5] and [8.0] bands). The dash-dotted lines present the FOV of the Chandra X-ray observation. The solid lines show the FOVs for VIMOS imaging and spectroscopy. The central line-filled regions were covered with HST observations.
Current usage metrics show cumulative count of Article Views (full-text article views including HTML views, PDF and ePub downloads, according to the available data) and Abstracts Views on Vision4Press platform.
Data correspond to usage on the plateform after 2015. The current usage metrics is available 48-96 hours after online publication and is updated daily on week days.
Initial download of the metrics may take a while.