Fig. 1
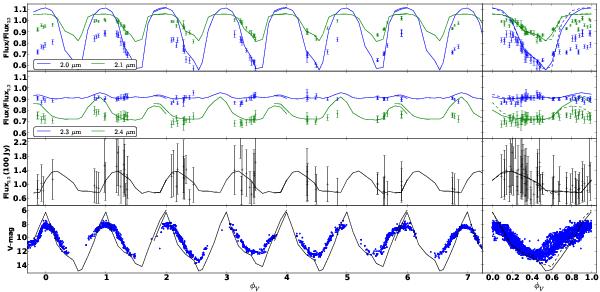
Spectro-photometry. The two upper panels show the variation in the spectral shape with respect to the 2.2 μm channel, the third panel shows the absolute flux in the latter, and the lower panel the visual flux in magnitudes. In each panel two cycles of the R52 model series are consecutively overplotted as the solid line. On the left, the cycles are shown as a function of visual phase while on the right they are phase-folded.
Current usage metrics show cumulative count of Article Views (full-text article views including HTML views, PDF and ePub downloads, according to the available data) and Abstracts Views on Vision4Press platform.
Data correspond to usage on the plateform after 2015. The current usage metrics is available 48-96 hours after online publication and is updated daily on week days.
Initial download of the metrics may take a while.