Fig. 4
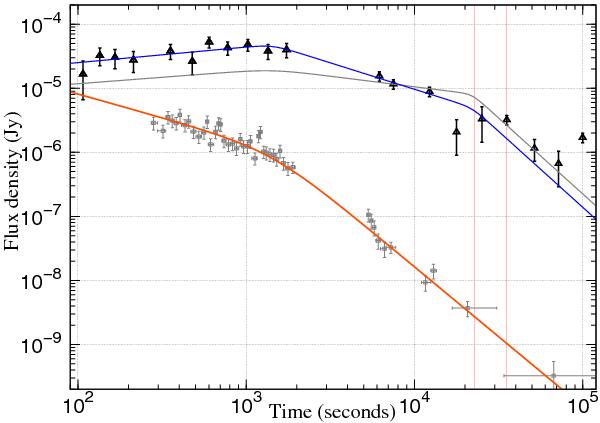
Best fit of the UVOT white-band data (black triangles, taken from De Pasquale et al. 2010, their Fig. 1) for two models that require a second break in the UVOT light curve at 22 ks (see Sect. 3.3). Also shown are the X-ray data, shifted in flux density by a factor of 104. The two vertical lines highlight the time interval in which GROND was observing.
Current usage metrics show cumulative count of Article Views (full-text article views including HTML views, PDF and ePub downloads, according to the available data) and Abstracts Views on Vision4Press platform.
Data correspond to usage on the plateform after 2015. The current usage metrics is available 48-96 hours after online publication and is updated daily on week days.
Initial download of the metrics may take a while.