Fig. 3
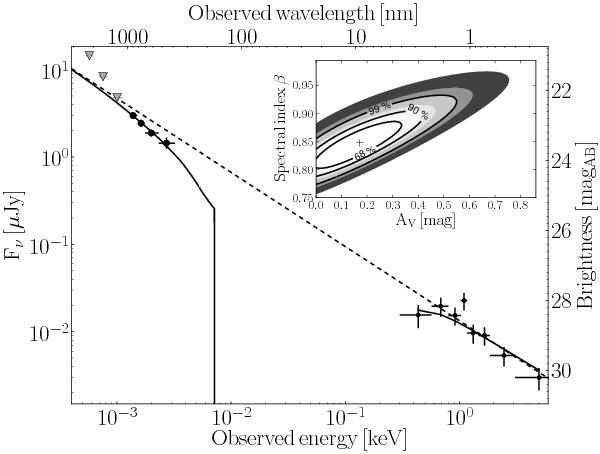
Swift/XRT (Evans et al. 2007) to optical/NIR (GROND) spectral energy distribution of the afterglow of GRB 090510 at t = 31 ks after the burst. The inset shows the βopt vs.  plane, constraining their corresponding error bars. Filled triangles refer to the GROND-observed NIR upper limits (J = 22.2, H = 21.6, and Ks = 21.0), filled circles to the observed optical magnitudes (g′,r′,i′,z′).
Current usage metrics show cumulative count of Article Views (full-text article views including HTML views, PDF and ePub downloads, according to the available data) and Abstracts Views on Vision4Press platform.
Data correspond to usage on the plateform after 2015. The current usage metrics is available 48-96 hours after online publication and is updated daily on week days.
Initial download of the metrics may take a while.