Fig. 1
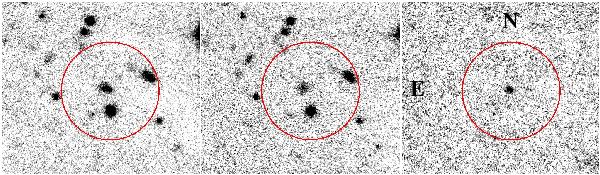
GROND (g′r′i′z′) white band finding chart of the afterglow of GRB 090510. Left: the afterglow plus its host galaxy on the night of the burst between 22 ks and 36 ks after the trigger. The afterglow flux dominates the western part of its host galaxy. (North is up and east is to the left.) Middle: in the second night the afterglow faded away, with only the host galaxy visible. Right: image subtraction between the first and the second epoch white band image clearly revealing the afterglow. The circle with a radius of 10′′, centered on the position of the afterglow, is just drawn to guide the eye.
Current usage metrics show cumulative count of Article Views (full-text article views including HTML views, PDF and ePub downloads, according to the available data) and Abstracts Views on Vision4Press platform.
Data correspond to usage on the plateform after 2015. The current usage metrics is available 48-96 hours after online publication and is updated daily on week days.
Initial download of the metrics may take a while.