Fig. 10
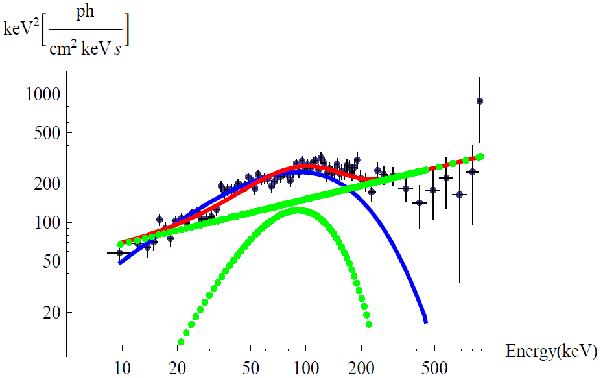
Fit of the spectrum of episode 2. The green dotted lines represent the fit of a black body and a power-law components, separately. The red line is the sum of them, calculated with XSPEC (BB+po). The blue line is the fit with the modified black body spectrum given in Eq. (1), calculated with the GRBsim numerical code.
Current usage metrics show cumulative count of Article Views (full-text article views including HTML views, PDF and ePub downloads, according to the available data) and Abstracts Views on Vision4Press platform.
Data correspond to usage on the plateform after 2015. The current usage metrics is available 48-96 hours after online publication and is updated daily on week days.
Initial download of the metrics may take a while.