Fig. 1
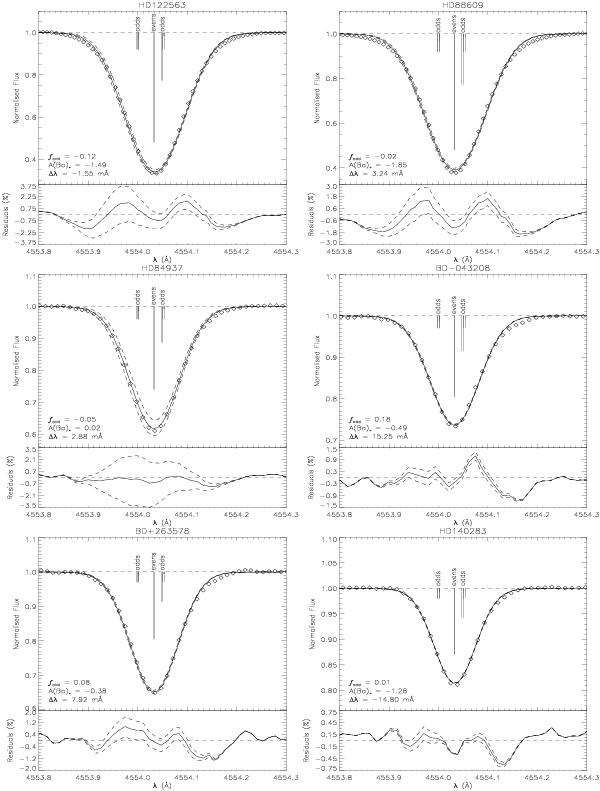
The best fit Ba ii 4554 Å lines for each star, using a Gaussian broadening technique. Each figure displays the observed Ba profile (diamonds) and the best fit synthetic profile (solid line), which includes the error on fodd (dashed line). We have also included a schematic of the odd and even isotopes for reference. The lower panel of each figure shows the residuals (obs-syn) of each fit as a percentage. For reference we have included HD 140283, which was analysed in Gallagher et al. (2010).
Current usage metrics show cumulative count of Article Views (full-text article views including HTML views, PDF and ePub downloads, according to the available data) and Abstracts Views on Vision4Press platform.
Data correspond to usage on the plateform after 2015. The current usage metrics is available 48-96 hours after online publication and is updated daily on week days.
Initial download of the metrics may take a while.