Fig. 2
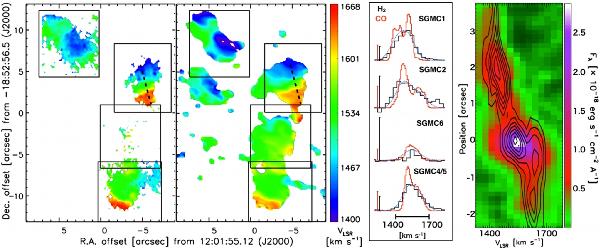
Left panel: velocity map of H2 1−0 S(1) (left) and first-moment map of CO(3−2) (right). Dotted lines mark the position-velocity cut shown in the right panel. Mid panel: integrated line profiles of CO(3−2) (red) and H2 1−0 S(1) (black) for each SGMC. Blue spectra show the CO(3−2) lines convolved to the spectral resolution of SINFONI. Black bars correspond to 5 × 10-16 erg s-1 cm-2 Å-1 for H2 1−0 S(1) and red bars to 1.5 Jy for CO(3−2), for all SGMCs. Offsets between the black and blue spectra indicate variations in the CO-to-H2 ratio between velocity components. Right panel: H2 1−0 S(1) position-velocity diagram of SGMC 2 (H11), with CO(3−2) emission shown as contours in steps of 0.02 Jy beam-1 starting at 0.03 Jy beam-1.
Current usage metrics show cumulative count of Article Views (full-text article views including HTML views, PDF and ePub downloads, according to the available data) and Abstracts Views on Vision4Press platform.
Data correspond to usage on the plateform after 2015. The current usage metrics is available 48-96 hours after online publication and is updated daily on week days.
Initial download of the metrics may take a while.