Fig. 1
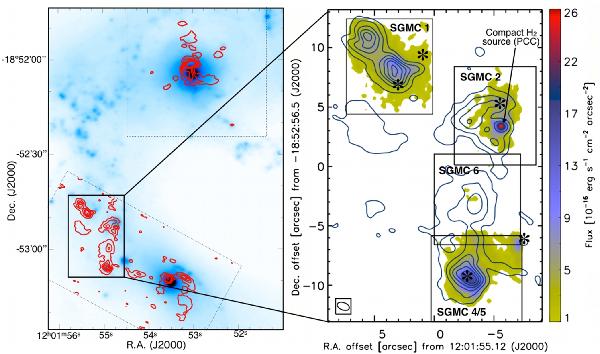
Left. ALMA CO morphology shown on top of our CFHT K-band continuum image (H11). Dotted boxes mark the two ALMA mosaics, the solid box marks the overlap region. Right. H2 1−0 S(1) morphology as seen with SINFONI. Boxes mark individual SINFONI fields-of-view, contours show CO(3−2) from 2 to 42 Jy km s-1 beam-1 in steps of 8 Jy km s-1 beam-1. The inset at the bottom left of the right panel shows the ALMA beam. We also mark massive and young SSCs (asterisks), and the compact H2 source PCC discussed in Sect. 3.
Current usage metrics show cumulative count of Article Views (full-text article views including HTML views, PDF and ePub downloads, according to the available data) and Abstracts Views on Vision4Press platform.
Data correspond to usage on the plateform after 2015. The current usage metrics is available 48-96 hours after online publication and is updated daily on week days.
Initial download of the metrics may take a while.