Fig. 7
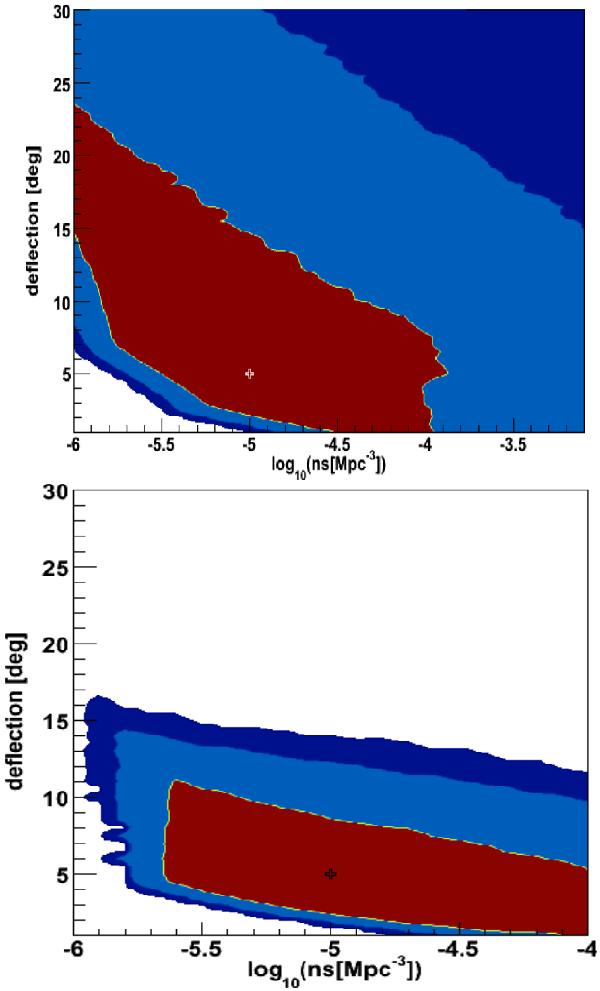
Influence of the underlying source distribution on the astrophysical constraints derived from the clustering analysis. The confidence contours (see Fig. 6 for colour meaning) are extracted from the analysis of a typical data set of 50 events above an energy threshold of 60 EeV, built from a typical realization of the reference model (ns = 10-5Mpc-3, δ = 5°), indicated by a cross, assuming either an a priori uniform source distribution (on the left) or an anisotropic distribution (on the right) similar to that of the galaxies (see text).
Current usage metrics show cumulative count of Article Views (full-text article views including HTML views, PDF and ePub downloads, according to the available data) and Abstracts Views on Vision4Press platform.
Data correspond to usage on the plateform after 2015. The current usage metrics is available 48-96 hours after online publication and is updated daily on week days.
Initial download of the metrics may take a while.