Fig. 6
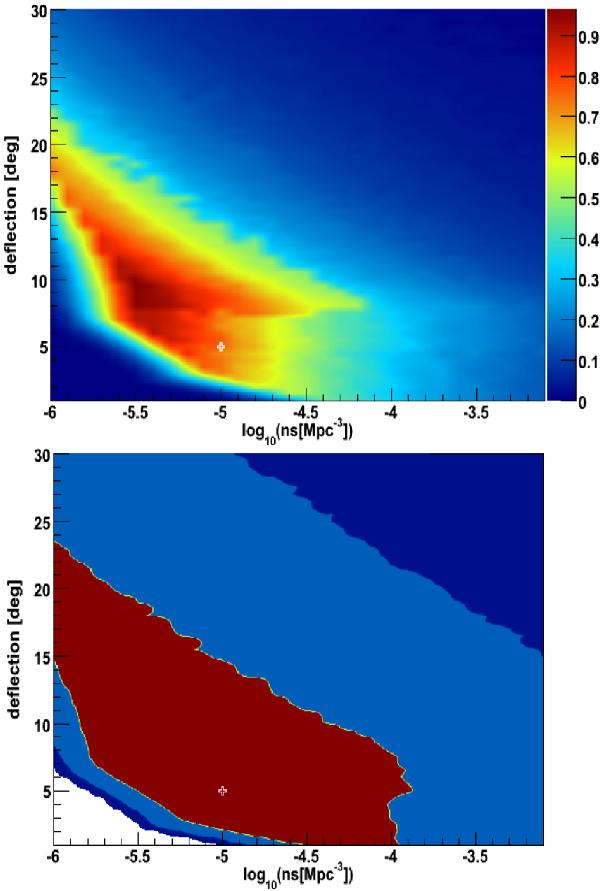
Top: values of the “clustering similarity”  for all tested pairs of parameters (ns,δ), obtained from the analysis of a typical data set built from a realization of the reference model
  = (ns = 10-5Mpc-3,δ = 5°), indicated by the white cross. For all models considered here, a uniform distribution of the sources was assumed. Bottom: confidence contours of 68% (red), 95% (light blue) and 99% (dark blue) extracted from the same data set . These plots can be interpreted as giving the regions of the parameter space that are most compatible with the reference data set (see text for details).
Current usage metrics show cumulative count of Article Views (full-text article views including HTML views, PDF and ePub downloads, according to the available data) and Abstracts Views on Vision4Press platform.
Data correspond to usage on the plateform after 2015. The current usage metrics is available 48-96 hours after online publication and is updated daily on week days.
Initial download of the metrics may take a while.