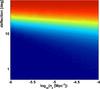
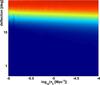
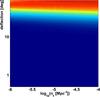
Fig. 4
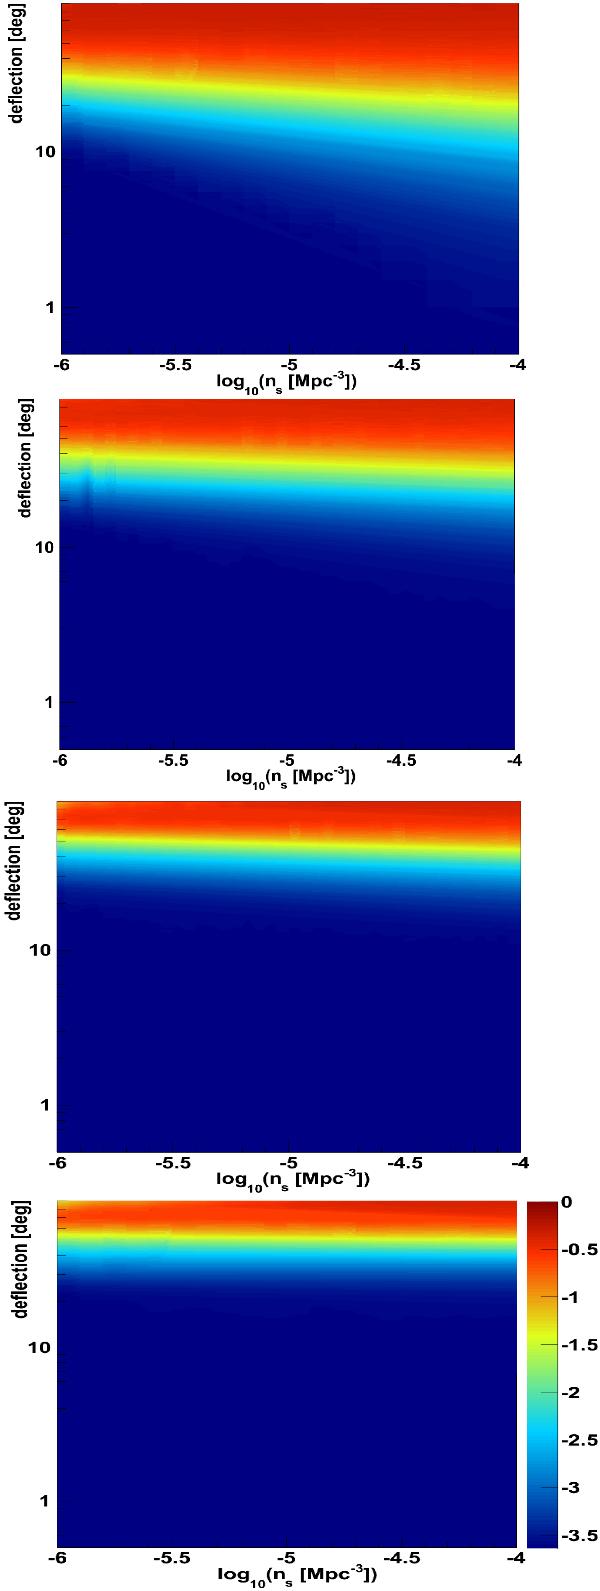
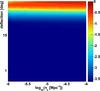
Mean value of  for 100 realizations of reference data sets with parameters ns and δ (see Fig. 3 for axis definition). Four sizes of data sets are considered: (downwards) 60, 100, 300 and 600 events. All data sets are built from an a priori anisotropic source distribution, following that of the nearby galaxies. The tested model corresponds to the isotropy hypothesis.
Current usage metrics show cumulative count of Article Views (full-text article views including HTML views, PDF and ePub downloads, according to the available data) and Abstracts Views on Vision4Press platform.
Data correspond to usage on the plateform after 2015. The current usage metrics is available 48-96 hours after online publication and is updated daily on week days.
Initial download of the metrics may take a while.